A purchase request can look straightforward. A user submits it, a manager reviews it, procurement processes it, and an order is issued. In practice, some requests finish in two days while others remain open for weeks without an obvious explanation.
Process bottleneck analysis helps teams identify the stages that consume the most time. Instead of simply asking who is slow, the analysis examines activity sequences, waiting time, rework, rejection, and differences between transaction types. The result is a basis for review, not a verdict about an individual or department.
Begin with a focused process question
The question “why are approvals slow” is too broad. Make it testable by asking which stage takes the longest, which request type is returned most often, or which unit shows the widest time variation. Choose one process and one period to keep the first analysis manageable.
Business process mining uses activity records to reconstruct how a process actually runs. The real path may differ from the written procedure because of exceptions, rerouting, or extra steps. Process owners need to help interpret those differences.
Prepare three essential data elements
Every case needs a consistent identifier, such as a request number, order number, or claim number. Each record also needs an activity name and event time. Transaction timestamp data can show when a request was created, reviewed, returned, approved, and completed.
Where available, use start and end times to separate active work from waiting. Add attributes such as department, category, value, location, customer type, or responsible resource when they support the question. Data use should follow authorized access and the stated analytical purpose.
Separate active time from waiting time
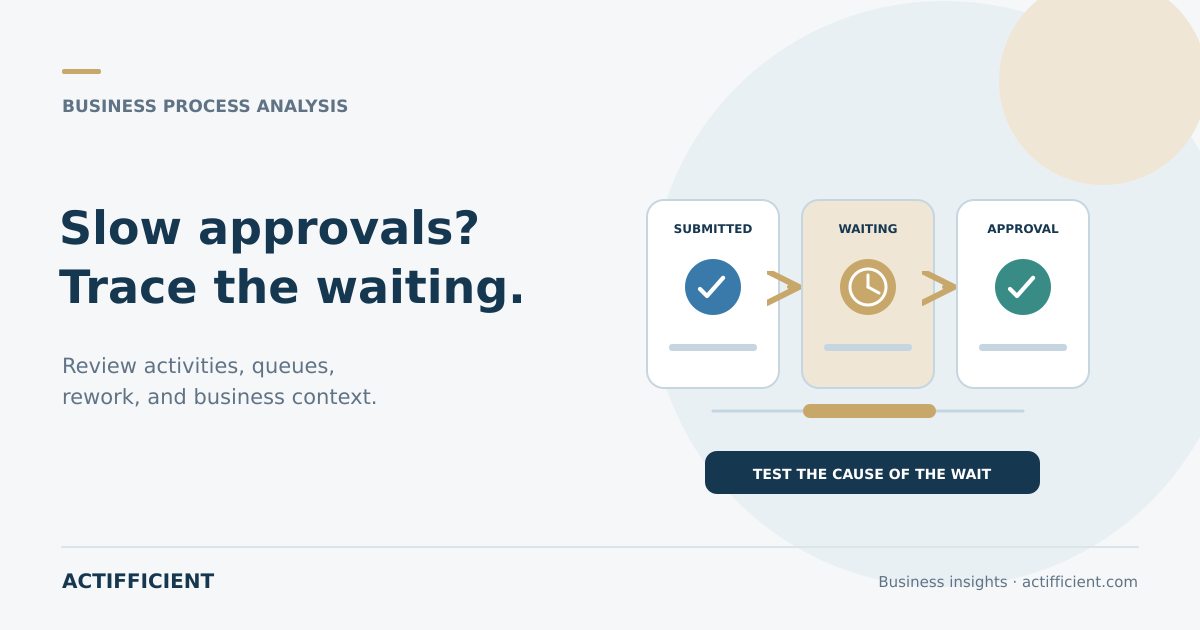
A task may require only a few minutes of work, yet the case waits for two days before anyone opens it. Process time analysis needs to distinguish the two. Without that distinction, a team may conclude that the activity is complex when the real issue is a queue or work allocation.
Compare the median and range, not only the average. A small number of extremely long cases can move the average substantially. Also review the percentage of cases that exceed the target time so the operational impact is easier to understand.
Find rework and unusual paths
Slow processes often contain repeated steps. A request may move backward because information is missing, values changed, documents are incorrect, or the approval authority does not match. Process cycle analysis shows how often cases return to an earlier stage and how much time that adds.
Use workflow anomaly detection to identify rare paths, unusually long durations, or unexpected activity sequences. An anomaly is not automatically an error. High value cases, special requests, or additional reviews may have legitimate explanations.
Compare relevant groups
Do not compare every transaction as if each had the same level of difficulty. Segment cases by value, category, location, complexity, or document requirements. A routine travel approval is not fairly compared with a major asset purchase.
Segmentation makes operational process efficiency more meaningful. When one group is substantially slower, examine capacity, approval rules, input quality, system behavior, and dependencies on other parties.
Use visualization to support discussion
A business process dashboard can show case volume, stage duration, waiting time, rework, process variants, and cases that exceed targets. Authorized users should be able to trace a metric to representative cases when further review is needed.
Useful visuals encourage better follow up questions. Why did waiting time increase during a particular week? Why is one category repeatedly returned? Did a form change reduce rework? Answers still require source data and operational context.
The role of AI in process analysis
AI Data Analytics can help users formulate questions, explore patterns, connect authorized data sources, and suggest additional tests. It can also help prioritize areas for review and present results in a more understandable form.
AI cannot learn every business explanation from timestamps alone. A policy change, staff shortage, system interruption, or incomplete request requires human context. Data driven decision making therefore still depends on validation by process owners and supporting evidence.
Test one improvement and measure the result
Choose an improvement that can be tested, such as clarifying a form, revising an approval threshold, organizing a queue, or sending a notification as a case approaches its deadline. Define the measure before the change, then compare duration, rework, and overdue cases after implementation.
Explore Actifficient's AI Data Analytics solution to investigate patterns, anomalies, and context from connected sources. If your team wants to test one process with representative data, contact Actifficient for a consultation. Prepare sample case identifiers, activities, timestamps, and available attributes so the initial scope can be assessed clearly.