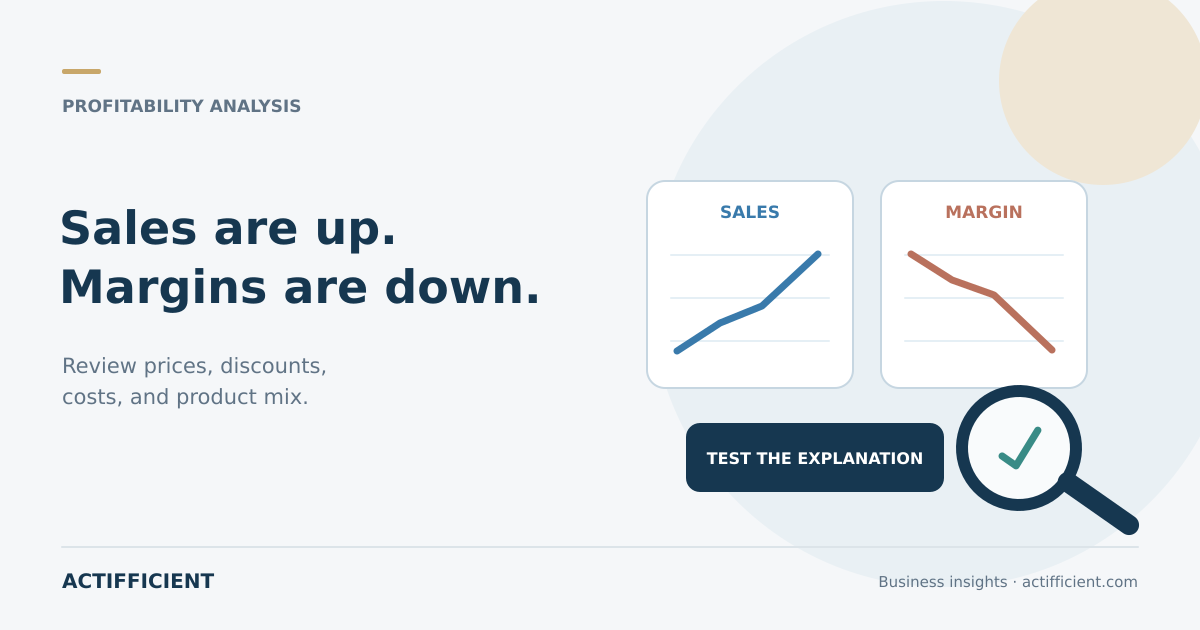
This month's sales are higher than last month's. The result sounds encouraging until the finance report shows that gross profit has fallen. The discussion quickly shifts to discounts, rising product costs, and possible data errors.
This situation requires sales margin analysis, not another comparison of revenue totals. Sales can grow because transaction volume increases while the profit earned on each transaction becomes smaller. The cause is difficult to see unless price, cost, discounts, returns, and product mix are examined together.
An AI Data Analytics approach can help a team screen large transaction sets, surface unusual patterns, and direct attention to areas that deserve review. The output still needs to be tested against business context and supporting records.
Begin with one margin definition
Different teams may calculate margin differently. Sales may look at revenue before discounts. Finance may use net revenue after returns. A product team might rely on standard cost while another report uses actual cost.
These differences can make the company profit margin appear to change even when the underlying business has not moved in the same way. Define how selling price, discounts, tax, product cost, delivery, commission, and returns are treated.
Confirm the period and currency as well. Daily sales should not be compared directly with a monthly cost allocation. Exchange rates and incomplete cost updates can also distort the result.
Separate volume growth from profitable growth
Revenue may rise because the company sells more low margin items. A highly profitable product could still perform well while representing a smaller share of total sales. Product profitability analysis therefore needs unit volume, net revenue, cost, and margin for each product or service.
Break the result down by category, branch, customer, channel, and salesperson. This shows whether a business margin decline affects the whole company or is concentrated in a particular area.
A low margin product should not be removed automatically. It may attract new customers, support another product, or serve a strategic purpose. The analysis identifies a pattern, while the commercial decision requires wider judgment.
Review unusual prices and discounts
Transaction prices can vary because of promotions, customer agreements, price list changes, or input mistakes. Price anomaly detection helps locate transactions that are far below the normal range for a comparable product and period.
Continue with sales discount analysis. Compare discount levels with approval authority, customer type, campaign terms, and transaction outcomes. A large discount is not necessarily incorrect, but it should have a clear basis.
Layered discounts deserve attention as well. Several modest reductions can create a significant total discount when applied together. Confirm that the system follows approved rules and does not apply expired promotions.
Connect sales with costs and returns
Margin depends on more than price. Higher purchase, material, delivery, commission, and service costs can reduce profit. Effective sales data analysis connects transaction data with the relevant costs instead of viewing revenue in isolation.
Returns and cancellations also matter. A sale may be recorded in one period while the related return appears in the next. If the original transaction and return are not linked, the report can make a margin movement look sudden or unexplained.
Decide how fixed and variable costs are allocated. The method should remain consistent so periods can be compared fairly. A company should not change cost allocation simply to produce a more comfortable result.
Use patterns to prioritize investigation
The team does not need to open every invoice. Rules can flag margin changes beyond a reasonable threshold, unusual discounts, sharp cost increases, or a sales mix that differs substantially from the previous period.
A sales margin dashboard can show trends and allow users to move from a summary into the underlying transactions. A red or green indicator alone is not enough. People need to understand which transactions form the result and what changed.
Analytical tools can rank factors associated with an outcome. An association does not prove that one factor caused the decline. Promotions, seasonality, supplier changes, and sales strategy still require discussion with the process owner.
Turn findings into a testable decision
Once a pattern appears, list the plausible explanations. Margin may have fallen because of product mix, rising costs, excessive discounts, or incomplete cost data. Test each possibility with transaction details and supporting documents.
With data driven decision making, an action should be more precise than “reduce discounts.” Define the affected segment, the revised rule, the owner, and the measure of success. Monitor the result after implementation to see whether the action actually improves margin.
Good analysis does not search for numbers that support the first assumption. It helps the team understand what changed, where it changed, and what evidence still needs to be collected.
Want to investigate margins, prices, discounts, costs, and transaction anomalies through a traceable process? Explore Actifficient data analysis solutions, then contact Actifficient to discuss your data structure, business questions, and required outputs.